The weight to height chart is actually a decent guide for those who don’t lift weights. But instead lead generally active lifestyles via exercise such as walking or running. Those who do enjoy bodybuilding (building a body which anyone can do!) regularly must keep in mind that the body mass index (BMI) becomes invalidated. Especially with years of strength training under your belt. And it could place you a full category above what you would be, without the extra muscle! So, it can be confusing.
Take my bodyweight for example. I’ve been building a body (worded as such because many freak out at bodybuilding) for 7 years. As seen below or via the Very well fit chart, my natural weight is around 150 pounds at 5 foot 8.5 (yes it matters!). Although my weight is currently 177 pounds and Kate’s is 147 pounds. Are we over weight? Technically, via the weight to height chart – yes (Kate almost). But when it comes to body composition (muscle to fat ratio), not at all.

Body Composition is more Important than the Weight to Height Chart
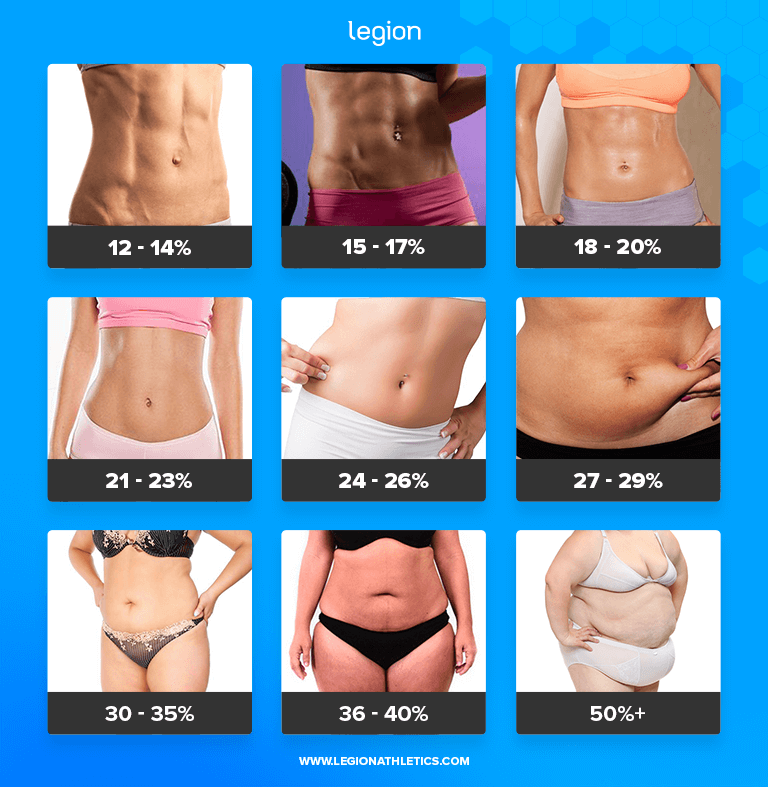
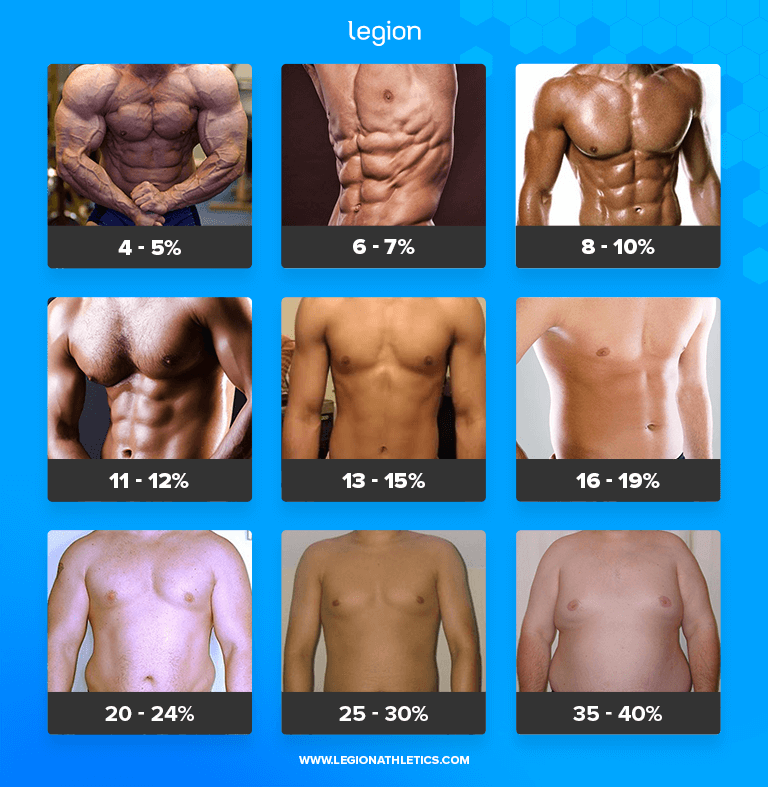
So, how do we measure body composition? There are actually many ways from expensive to cheap. But honestly, the best way is probably the cheap one. Because even DEXA scans aren’t completely accurate at 1-2% margin of error and are around £150 per visit! And caliper measures have a 3-5% margin of error but are much cheaper. The other option is to gauge by comparing yourself to body fat percentage pictures like the ones below from Legion. But keep in mind, we all hold body fat differently and in specific areas. Such as the glutes or thighs! Also, I can be 10-11% body fat but still have a lower abdominal fat pouch.
Kate’s around the 20-22% mark which shows a very healthy body fat percentage.
My body fat percentage is between 12-15% which again clearly demonstrates not being over fat. Oh, If you want to learn more about healthy body fat targets check our other blog out.
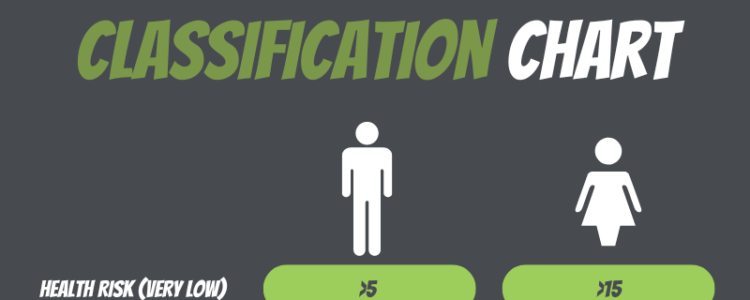
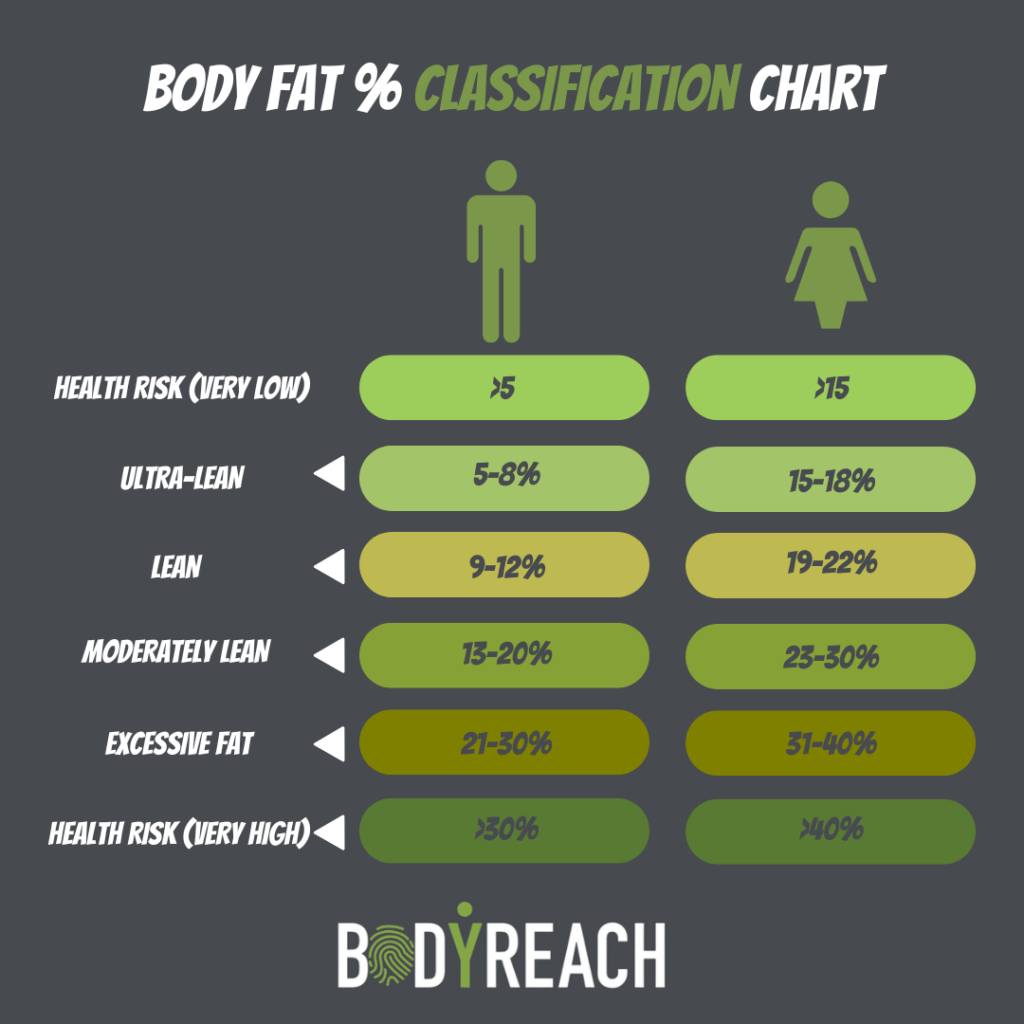
Body Fat Percentage Chart
Here’s a chart showing healthy and realistic body fat percentages.
So, what predicts health is what your body is comprised of. For example, you could be within the correct weight zone for your height and assume you’re healthy. But have very little muscle and lots of body fat I.e skinny fat. Also, you could be slim but have high visceral fat (internal organs) or atherosclerosis due to poor eating choices. Consequently, your health wouldn’t be optimal despite an otherwise healthy body weight.
Furthermore, when your body fat levels are in healthy zones, the extra muscle has major health benefits. Especially as we age! Such as prevention of osteoporosis and type 2 diabetes. In addition, less falls/injuries and all round better quality of life. Not to mention the positive mental affects that come from feeling, looking and being strong!
In finishing, using weight to height charts can be helpful to a degree. But it is a very limited tool for those who participate in any form of strength training. Or for those who eat very poor quality of foods but remain slim. So, choose your progress metrics carefully as they can very easily mislead, confuse or derail you from otherwise healthy living!
If you want to understand more on how to lift and get strong please send us a message via this page! And if you’re a female and are still unsure about this weight lifting business. Just know that 80% of our clientele are female and they absolutely LOVE it! Check this blog out if you’re still on the fence.
Was this blog helpful in any way?